


Architecture and decisions
Urgent operational clarity during disasters
When severe weather approaches landfall within 48 hours, emergency response coordinators cannot spend hours cross-referencing multiple federal databases. They must quickly identify whether residents can receive digital warnings, whether they have evacuation mobility, and how many individuals depend on electricity for life-sustaining medical equipment.
The federal schema fragmentation problem
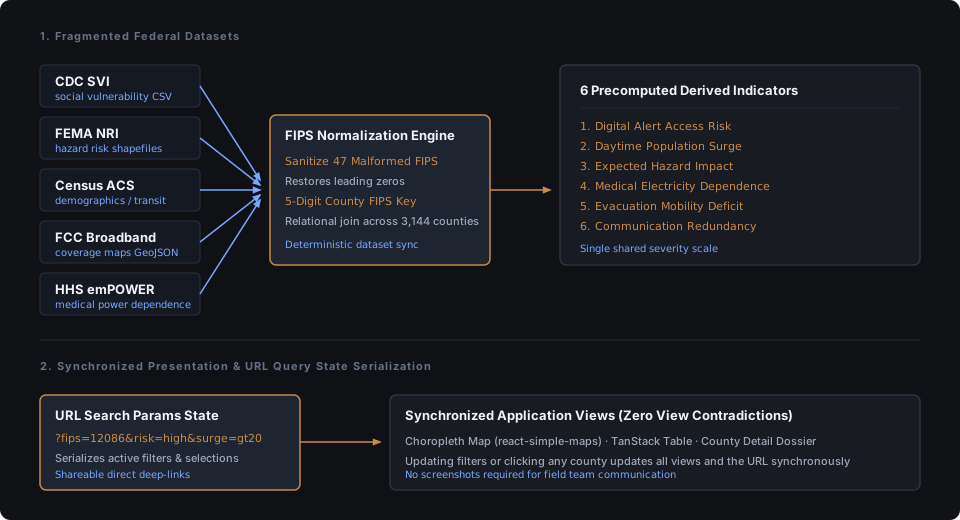
Federal agencies maintain data in isolated repositories. The CDC publishes Social Vulnerability Index tables, FEMA releases National Risk Index shapefiles, the Census publishes ACS demographic data, the FCC tracks broadband availability, and HHS monitors emPOWER medical records. In early prototypes, each dataset resided in a separate interface tab. A county appeared as severe risk on the flood map but low risk on the demographic panel, creating confusion during resource allocation.
Standardizing on county FIPS and centralized derivation
I consolidated all five datasets using the 5-digit county FIPS code as the single relational join key across 3,144 United States counties. Ingestion revealed 47 malformed county records where spreadsheet exports had dropped leading zeros from FIPS codes. After resolving the keys, we derived six composite indicators once at build time: digital alert access risk, daytime population surge, hazard impact potential, medical power dependence, evacuation mobility deficit, and communication redundancy. The choropleth map, data table, map legend, and county inspector share a synchronized severity scale, ensuring data consistency across all views.
State serialization for field coordination
Emergency response teams in the field cannot rely on static screenshots. Every active filter, search parameter, selected county, and risk threshold serializes directly to URL query parameters. An analyst in a regional coordination center can isolate high-risk coastal communities and share that exact interactive configuration with field personnel through a URL.
Data hygiene is the core product
Data cleaning and schema reconciliation accounted for more than half of the project timeline. If geographic join keys are malformed or normalization scales conflict, even well-designed visual interfaces will deliver incorrect operational insights.